

Vogle Graphics Library
The Vogle (Very Ordinary Graphics Learning Environment) graphics package provides C++ functions for doing simple graphics and plotting data.
Graphics library functions
The following are some of the Vogle graphics functions that are commonly used. The function prototypes and an explanation of the parameters are listed.
- void vogleinit(float xlo, float xhi, float ylo, float yhi);
Creates a window with default background (WHITE), default foreground (BLACK) and a default margin around the graph. The parameters specify the minimum and maximum x and y values to be plotted. - void xaxis(float xlo, float xhi, int nxticks, float y, float ticksize,
char title[], float labello, float labelhi);
Draw an axis between (xlo, y) and (xhi, y). The axis should have nxticks of length ticksize, and a title (char array) which is placed under the axis. The ticks themselves are labelled with values ranging from labello to labelhi. - void color(int color);
Options for color include BLACK, RED, GREEN, YELLOW, BLUE, MAGENTA, CYAN, WHITE. - void point2(float x, float y);
Draw a point at x, y. - void move2(float x, float y);
Move graphics position to point (x, y). - void draw2(float x, float y);
Draw from current graphics position to point (x, y). - int getkey();
Return the character (ASCII ordinal) of the next key typed at the keyboard. - void vexit();
Reset the window/terminal (must be the last Vogle function called).
Example to display a one-dimensional array
The following example uses these Vogle graphics library functions to plot the discrete normal distribution. The prototypes of the functions are declared in the following two header files which are included in the usual way at the top of the program file:
   #include <vogle.h>
   #include <vogleextras.h>
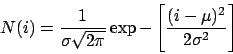
Discrete samples from the normal distribution are computed from:
The normal data (61 discrete samples) is stored in a one-dimensional array, normalData[61], which is passed to a user-defined graphics function called PlotResultsVogle(), along with the number of elements (number = 61) in the function call:
PlotResultsVogle(normalData, number);
The Vogle library functions vogleinit(), xaxis(), yaxis(), color(), move2(), draw2() are used to initialise a graphics window, plot x and y axis, choose a colour for plotting, move to a position on the canvas and then draw to another position in the color defined.
(Double click on the icon with the file name PlotNormal.cc. Compile and run the program with different values for the standard deviation (1 ≤ ρ ≤ 15). )
// PlotNormal.cc
// Program to display a discrete normal distribution using Vogle Graphics

// C++ standard input/output and Math library headers
#include <iostream>
#include <cmath>

using namespace std;

// Vogle Graphics headers for library functions
#include <vogle.h>
#include <vogleextras.h>

// Prototype of user-defined graphics function which receives an array
void PlotResultsVogle(float dataArray[], int number);

int main()
{
   int i, number=61;
   float normalData[61], mean=35.0, deviation;
   float t1, t2;

   // User is prompted for standard deviation. Mean kept constant at 35.
   cout << "Input standard deviation of normal distribution: " << endl;
   cin >> deviation;

   // Calculate discrete normal distribution data.
   // The value of pi is declared in math as M_PI.
   for(i=0; i< number; i++)
   {
     t1 = (i -  mean)/deviation;
     t2 = -0.5*t1*t1;
     normalData[i] = exp(t2)/(deviation*sqrt(2*M_PI));
   }

   // Pass normalData array to Vogle graphical routines.
   PlotResultsVogle(normalData, number);
   return 0;
}
// Function to plot the one-dimensional array using Vogle library routines
void PlotResultsVogle(float dataArray[], int number)
{
   // Max and min values of user data to be plotted on graphical window
   float xlo=0.0, xhi = number - 1, ylo = 0.0, yhi=0.25;

   // Initialise Vogle Graphics and scale canvas to user coordinates
   vogleinit(xlo, xhi, ylo, yhi);

   //Draw x and y axes with nxticks and nyticks between max and min values
   int nxticks = 7, nyticks = 6;
   xaxis(xlo, xhi, nxticks, ylo, 0.005, "Outcome", xlo, xhi);
   yaxis(ylo, yhi, nyticks, xlo, 0.005, "Frequency", ylo, yhi);

   // Choose a colour for lines
   color(RED);
   // Plot data as discrete distribution
   for(int i=0; i<number; i++)
     {
       move2(i,0.0);
       draw2(i,dataArray[i]);
     }

   // Wait for key press to indicate that graphics window is to be destroyed
   cout << "Move pointer to vogle window and press any key" << endl;
   getkey();
   vexit();
}
Back to top