Design Cookbook: Beam Bending Examples
Cookbook Index
Introduction
One very common problem that students have in 2.007 is not making their arm or
structures stiff enough. This is a problem because the arms and structures usually need to
move or support things. A lack of stiffness is very common cause of machine unreliability.
Remember from 2.001 that the following factors need to be known to calculate the
stiffness of something.
- The Young's Modulus [E]:
- This is a material property that measures the stress/strain.
- The Cross-Sectional Inertia [I]:
- This is determined by the cross sectional geometry of the arm.
- The Loading Configuration:
- This gives your equation to calculate the the deflection. Typical configurations and
their equations are listed below.
Young's Modulus
Material |
Young Modulus E |
Shear Modulus G |
Poisson's Ratio
v |
ksi |
GPa |
ksi |
GPa |
| Aluminum (pure) |
10,000 |
70 |
3,800 |
26 |
0.33 |
| Aluminum alloys |
|
|
|
|
|
| 6061-T6 |
10,000 |
70 |
3,800 |
26 |
0.33 |
| 7075-T6 |
10,400 |
72 |
3,900 |
27 |
0.33 |
| Steel |
29,000 |
190-210 |
11,300 |
75-80 |
0.27-0.30 |
| Delrin |
|
3.1 |
|
|
0.35 |
|
|
|
|
|
|
Moments of Inertia
|
Return to Top of Page |
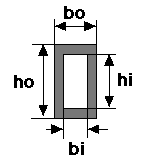
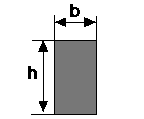
Cross Section |
Inertia |
|
|

|
|
|

|
|

|

|
|

|

|
|

|

|
| This is an approximation of a simple truss, ingoring the cross members. Both upper and
lower members have the same area (A). |
There are some tools to help you calculation the amount of deflection in
your structures. If you forget how to uses any of the matlab functions you can type help
<function name> for a description of how to uses that function.
 |
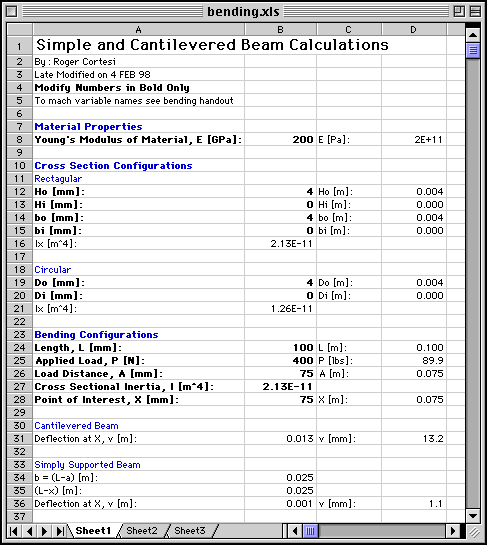
bending.xls
calculates the cross sectional inertia for circular and rectangular
sections. It also calculates the amount of delfection at a given point
for a smiply supported and cantilevered beam. |


|
recinert.m
and cirinert.m calculate
the cross sectional inertia for rectangular and circular cross sections
respectively. all units must be consistent.
RECINERT(A,B,C,D) and CIRINERT(A,B)
|
»help recinert

  RECINERT(A,B,C,D) calculates the cross sectional moment of interia for
  a rectangular cross section
  A = outer width, B = outer height
  C = inner width, and D = inner height

  To evalute a filled rectangle set C and D = 0

»help cirinert

  CIRINERT(A,B) calculates the cross sectional moment of interia for
  a pipe cross section
  A = outer diameter, B = inner diameter

  To evalutate a filled circle set B = 0

|
cantbeam.m
shows the deflection of a cantilevered beam loaded from 1 or more points.
CANTBEAM(P,a,L,E,I,incr)
|
»help cantbeam

  [def] = CANTBEAM(P,a,L,E,I,incr) returns arrays with
  the deflection [def].  [def] is also plotted.


 	P is the force applied to the beam in NEWTONS
 	a is the distance from the left end that the force is applied in METERS
 	L is the length of the beam in METERS
 	E is the young's modulus of the material in Pa
 	I is the cross sectional inertia in METER^4
 	icnr is the number of increments to sample along the beam

  Multiple forces can be entered in P, however, a must be the same length
  to give a position for each force.  P can be positive or negative.

  all values of a may not be greater then L
  E, I, a, incr, and L must be greater then 0

  def is in meters (plotted in mm)
Below is a sample plot from cantbeam.m for the following data:
L = 0.10 m
I = 2.1333e-11 m^4   (4mm by 4mm shaft)
E = 200E+9 Pa  (steel)
incr = 100
P = [-400 600 -200] N
a = [0.03 0.06 0.09] m
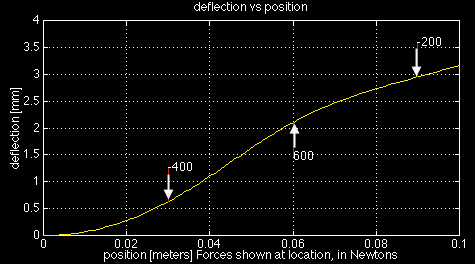
On the deflection plot the red lines are at the point of force application and they are
"pushing" the beam (e.i. a positive force will have its red line below the beam
"pushing" up). The values of each force is displayed at the end of its force
line.
The deflection is plotted in mm but the array returned for [def] is in meters!

|
simpbeam.m
shows the deflection
of a simple beam supported
at either
end, loaded from 1 or more points.
SIMPBEAM(P,a,L,E,I,incr) |
»help simpbeam

  [def] = SIMPBEAM(P,a,L,E,I,incr) returns an array with
  the deflection [def].  [def] is also plotted.

  ALL CALCULATIONS ARE FOR A SIMPLE BEAM SUPPORTED AT EITHER END

 	P is the force applied to the beam in NEWTONS
 	a is the distance from the left end that the force is applied in METERS
 	L is the length of the beam in METERS
 	E is the young's modulus of the material in Pa
 	I is the cross sectional inertia in METER^4
 	icnr is the number of increments to sample along the beam

  Multiple forces can be entered in P, however, a must be the same length
  to give a position for each force.  P can be positive or negative.

  all values of a may not be greater then L
  E, I, a, incr, and L must be greater then 0

  def arrary is in meters (plotted in mm)
Below is a sample plot from simpbeam.m for the following data:
L = 0.10 m
I = 2.1333e-11 m^4   (4mm by 4mm shaft)
E = 200E+9 Pa  (steel)
incr = 100
P = [-100 100 -100] N
a = [0.02 0.05 0.08] m
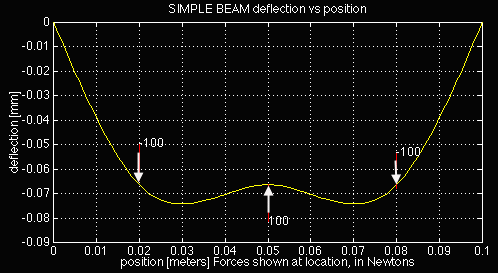
On the deflection plot the red lines are at the point of force application and they are
"pushing" the beam (e.i. a positive force will have its red line below the beam
"pushing" up). The values of each force is displayed at the end of its force
line.
The plot may look like the beam is bending a lot, but compare at the scale on the x
and y axis. In this example the maximum deflection is 0.075 mm for a 10 cm long
beam!
Return to Top of Page


