 Weight, Geometry, Lift, Drag and Thrust Properties.1. Weight. The weight (W) of the aircraft and its aerodynamic properties are the primary factors determining its flight performance. The weight of the aircraft can be broken down into fundamental components:
It is not simply a matter of adding the components together to obtain a final answer for the aircraft weight. For example it may be necessary to remove fuel weight so that additional payload may be carried while still maintaining the requirement of a maximum take-off weight. For stability and hence flight safety considerations an accurate "weight and balance" calculation should be performed prior to the flight of the aircraft. In flight the aircraft weight will change as fuel is burnt by the propulsion system or possibly dumped in an emergency situation. All the weight specifications will need to be identified from data given by the aircraft manufacturer before force equilibrium calculations can be applied. Aircraft Geometry. A typical aircraft planform layout is shown below.
 The mean aerodynamic chord can be found by integrating
the individual section chords across the span.  For wings with simple linear taper, the mean aerodynamic chord will
roughly equal the mean geometric chord,  The aspect ratio of the wing will be,   2. Lift and Lift Coefficient The aircraft generates lift by moving quickly through the air. The wings of the vehicle have aerofoil shaped cross-sections and for the given flow conditions the aerofoil shapes will create a pressure difference between upper and lower wing surfaces. There will be a high pressure region underneath and a very low pressure region on top. The lift produced will be proportional to the size of the aircaft; the square of its velocity; the density of the surrounding air and the angle of attack of the wing to on-coming flow. To simplify the problem, lift is typically measured as a non-dimensional
coefficient.  In the normal range of operations the variation of lift coefficent with
angle of attack of the vehicle will be approximately linear,  up until a maximum lift coefficient value at which point the wing flow stalls and lift reduces. The values of the lift curve gradient and maximum lift coefficient are effected by the shape of the wing, its twist distribution, the type of aerofoil section used, the flap configuration and most importantly by the amount of downwash flow induced on the wing by the trailing wing tip vortices. A simple approximation for straight, moderate to high aspect ratio wings
is to assume an elliptical spanwise load distribution which gives the
following result,  where it is assumed that the ideal two-dimensional result for the
section used is Calculation of zero angle lift coefficient or zero lift angle can be done by crudely assuming that the zero lift angle for the aircraft equals the combination of zero lift angle of the aerofoil section and wing incidence setting. Calculation of maximum lift coefficient can be again take as approximately equal to the two dimensional section data minus 5% due to the negative lift needed at the tailplane to maintain moment equilibrium. For swept wings, wings with complex taper or wings with flaps, a more accurate calculation needs to be undertaken using either lifting line theory or the vortex lattice method. 3. Drag and Drag Coefficient In moving through the air the aircraft experiences a resistive drag
force. This force is made up of several distinct components In theory the drag can be predicted by using a simple parabolic drag
assumption,  If the offset due to camber is neglected then this can be written simply as,  This lumps friction and pressure components into a constant base drag term and then treats the variation due to friction, pressure and most importantly lift induced drag, as a quadratic function of lift. The effect of compressibility can be predicted by the use of a correction
factor for speeds ranging from M=0.4 up to transonic.  For the more complex flows obtained in the transonic and supersonic regions, CFD analysis or experimental data is required to correctly estimate CD. The lift dependant component can be approximated as  where e is the wing planform efficiency factor. Values for these drag constants for various categories of aircraft are shown in the following table.
4. Production of Thrust
Thrust to overcome drag is produced by engines generally using one of the
following
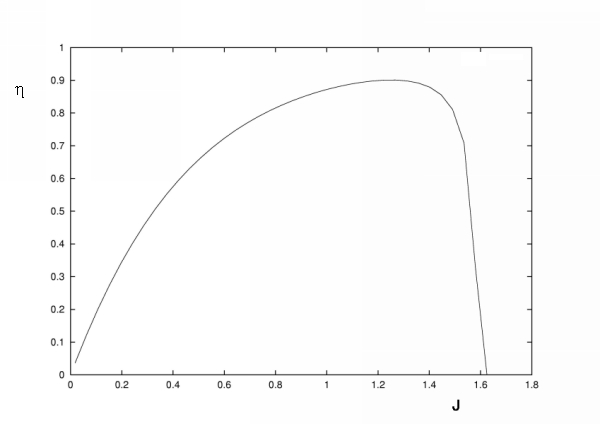
configurations, (b) Gas Turbine Engine driving a propeller (turbo-prop). (c) Podded High By-Pass Gas Turbine (subsonic) (turbo-fan). (d) Internal Low By-Pass Gas Turbine (supersonic) . Propeller Thrust For cases (a) and (b) engine horsepower performance data will be provided from the engine manufacturer. To find thrust, a reasonable estimate of propeller efficiency is required. Propeller efficiency can be measured against advance ratio, the ratio of forward to rotational speed of the propeller,
where V is forward speed of aircraft, n is the propeller rotation speed in revs/sec and D is the diameter of the propeller.
A typical fixed pitch propeller performance graph will be as follows,
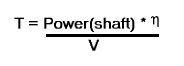
Typically maximum efficiency will be around 80% and for a fixed pitch propeller this will be achieved at an advance ratio corresponding to cruise speed and engine RPM settings. As the advance ratio at take-off is lower this may result in a take-off propeller efficiency of only 50%. By using a constant speed unit on the engine and thus varing the pitch in flight it is possible to maintain high efficiency for a range of advance ratios. The propeller will then run at maximum efficiency (80%) from take-off speed, through climb speed to cruise and high speed cruise. The constant speed units typically have a fixed range of pitch change so that again below take-off speed and above high speed cruise the propeller efficiency will rapidly decline. More advanced turbo-prop units have a greater pitch range including the options of reverse thrust and feathered (aligned with airflow, min drag with no rotation) positions. Given information regarding the propeller efficiency, the engine horsepower output and the speed of the vehicle, thrust produced by the propeller can be predicted by,
© AMME, University of Sydney, 1998-2006. |
 The wing planform area (S) is shaded as shown. The wing taper ratio
can be calculated as the ratio of tip chord to root chord,
The wing planform area (S) is shaded as shown. The wing taper ratio
can be calculated as the ratio of tip chord to root chord, .
.