Assembly Language Programming
Flow Charts for Assembly Language Programming
Flow Charts are a graphical technique for designing programs, and have a number of advantages for assembly language programming. They encourage the programmer to design the overall algorithm for a program without becoming mired in the details of microprocessor instructions. They are independent of microprocessor architecture, so once an algorithm has been devised successfully, it can be translated into assembly language programs that can be executed by various microprocessors. Flow charts are easier to read than machine code and anyone equipped with pen and paper can create them.
For larger tasks (as normally programmed in high-level programming languages), flow charts have been superseded by other techniques such as structured programming and object-oriented design. For tasks that require optimal efficiency and so may be written in pure machine code (e.g. digital signal processors), the programmer will exploit peculiarities of the instruction set and the architecture to obtain every iota of extra speed - in such circumstances, the exact instructions and how they interact matter, making flow charts less valuable.
Flow charts work best when the entire flow chart can be drawn on a single page. Once a flow chart becomes so large that it cannot be represented on a single page, care must be taken such that links from one page to another are made consistently.
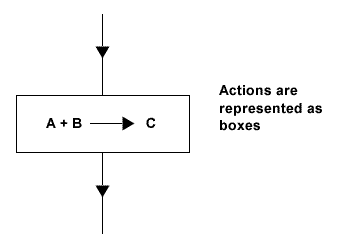
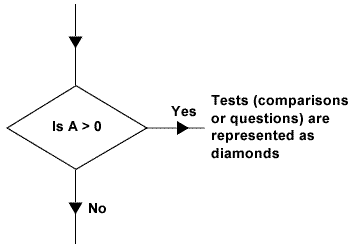
In flow chart terms, actions such as adding two numbers together are represented as rectangular boxes, whereas tests (questions or comparisons) such as "Is a certain value > 0?" are represented as diamonds. The start and end of a flow chart are both shown as circles with the words Start and End inside.
Flow Chart Symbol for Actions

Flow Chart Symbol for Decisions

